Dashboard asset hub
01
Search, edit, download, and track publish status in one place.

From fragmented reporting to
The product helps business users turn enterprise data into reusable dashboards through a visual builder, structured data binding, style controls, and a publish workflow.
01
Search, edit, download, and track publish status in one place.
02
Drag components onto a canvas and publish without code.
03
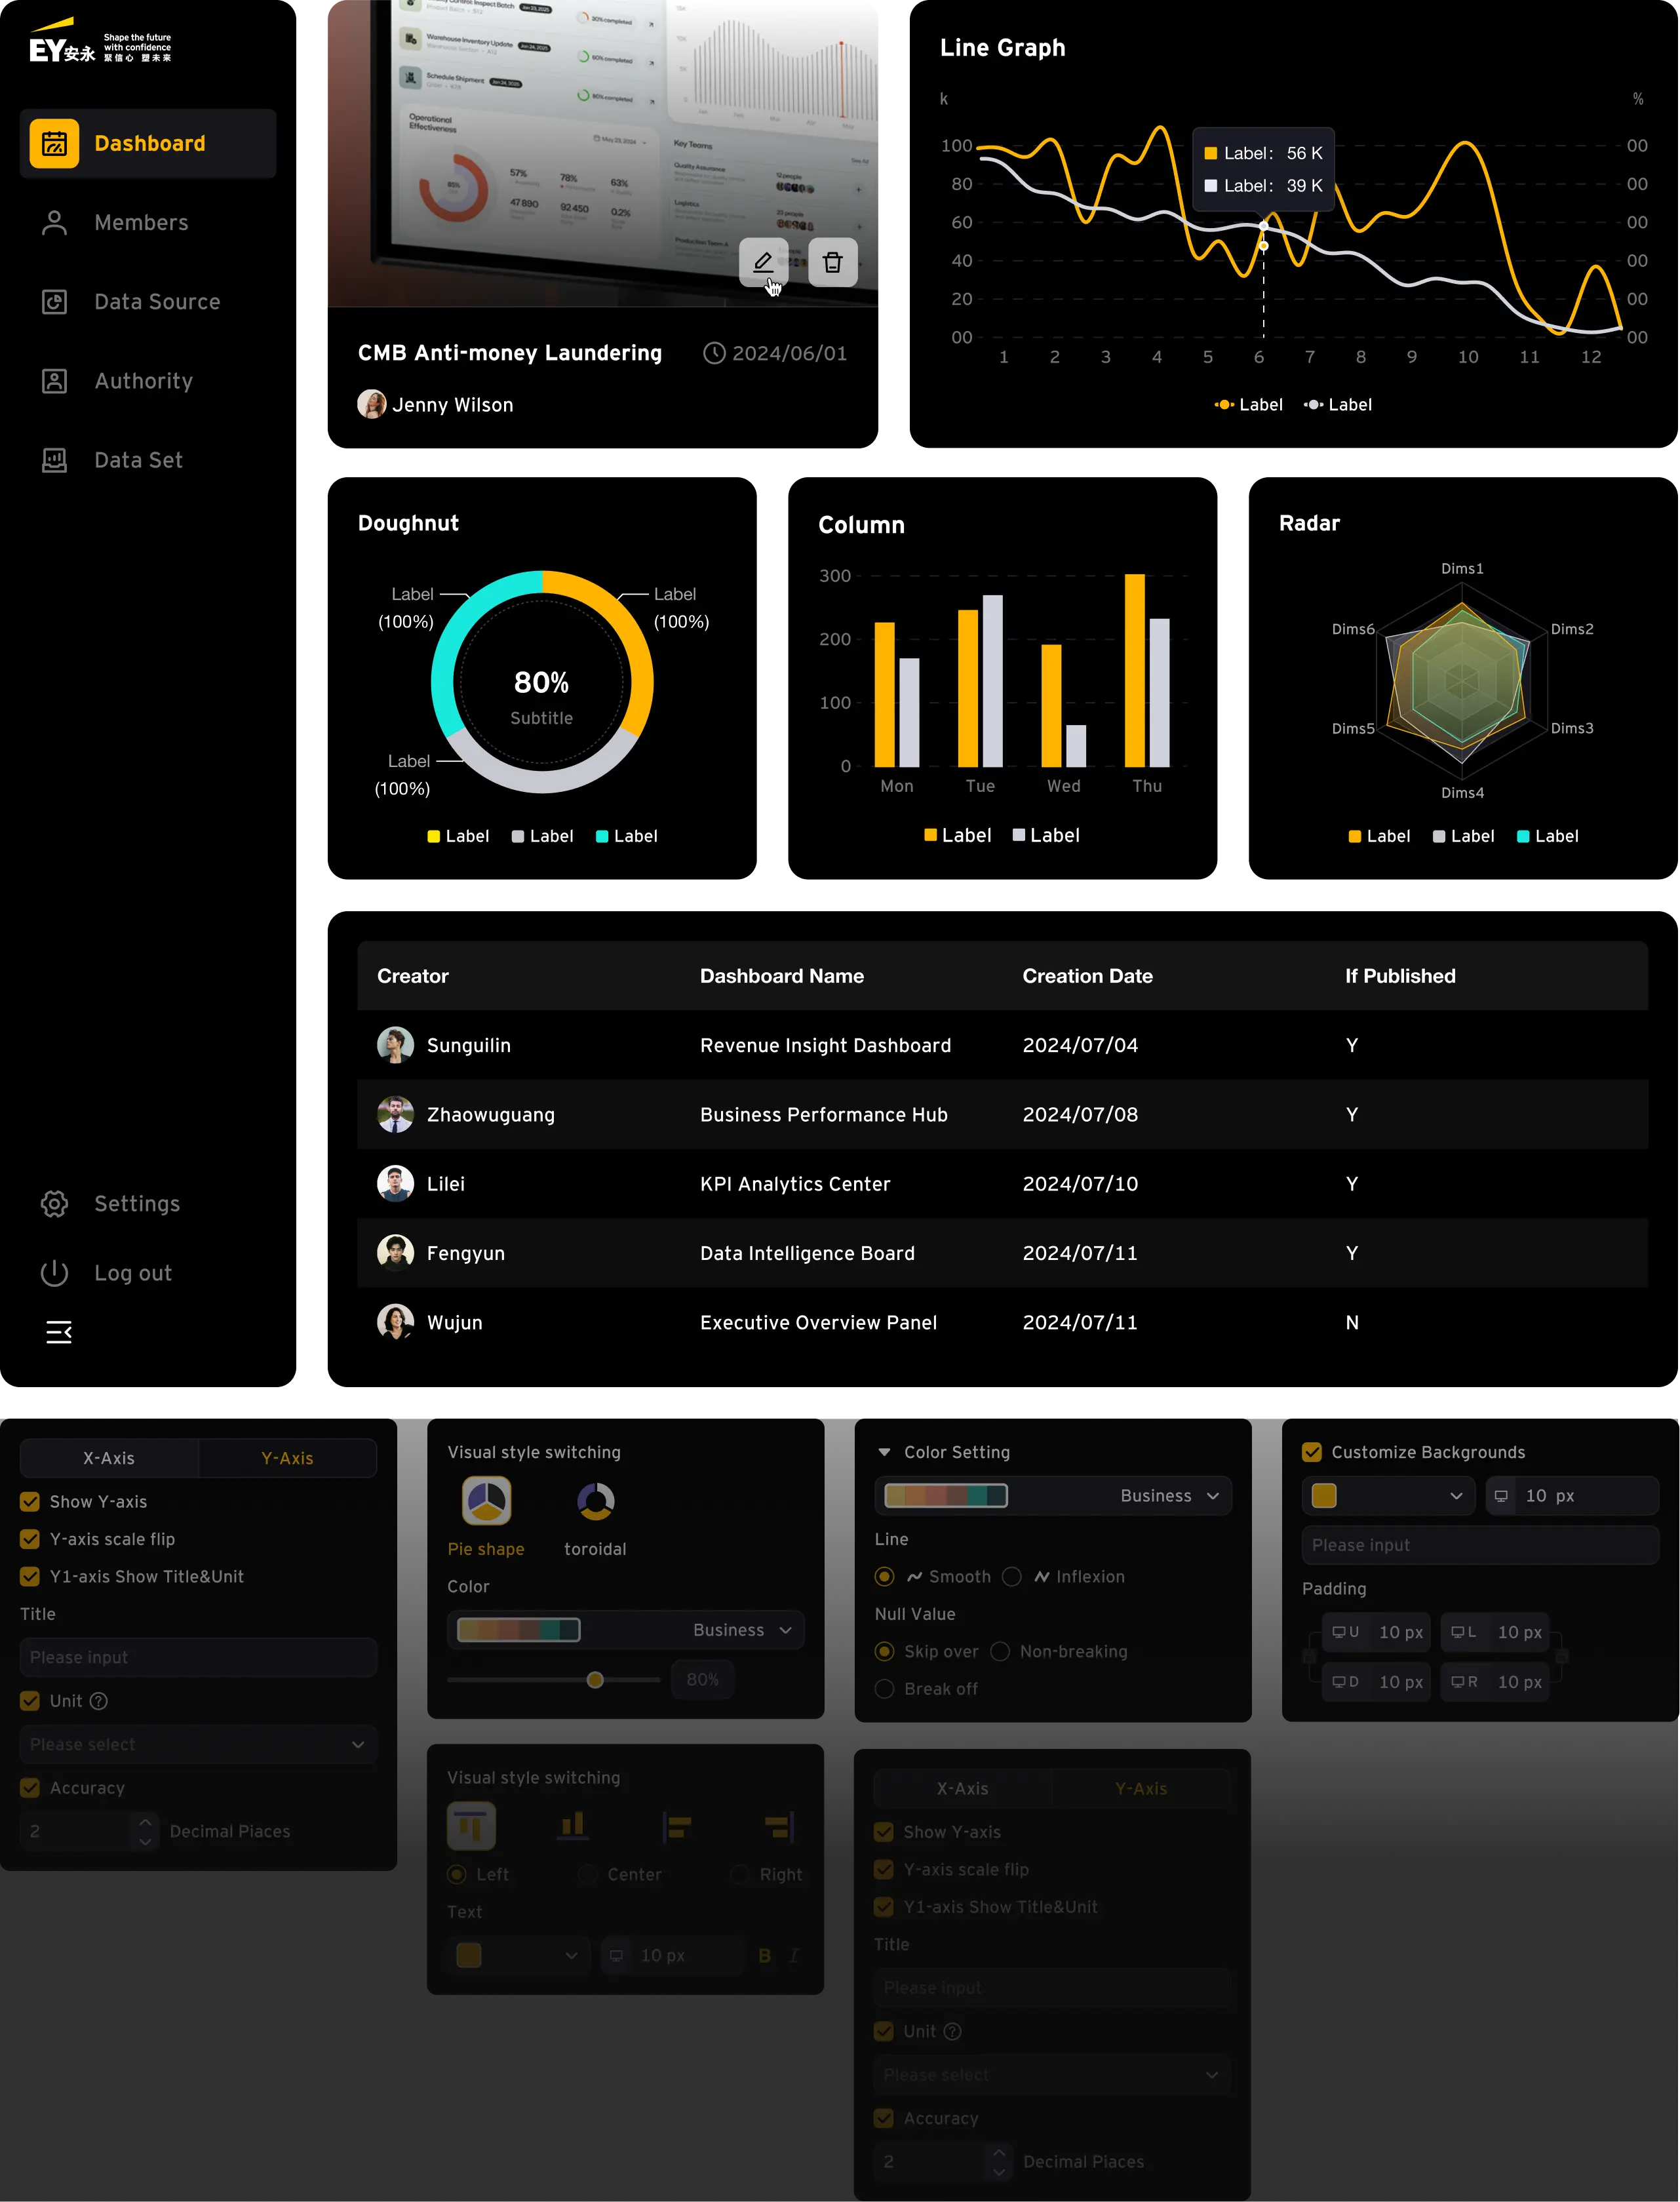
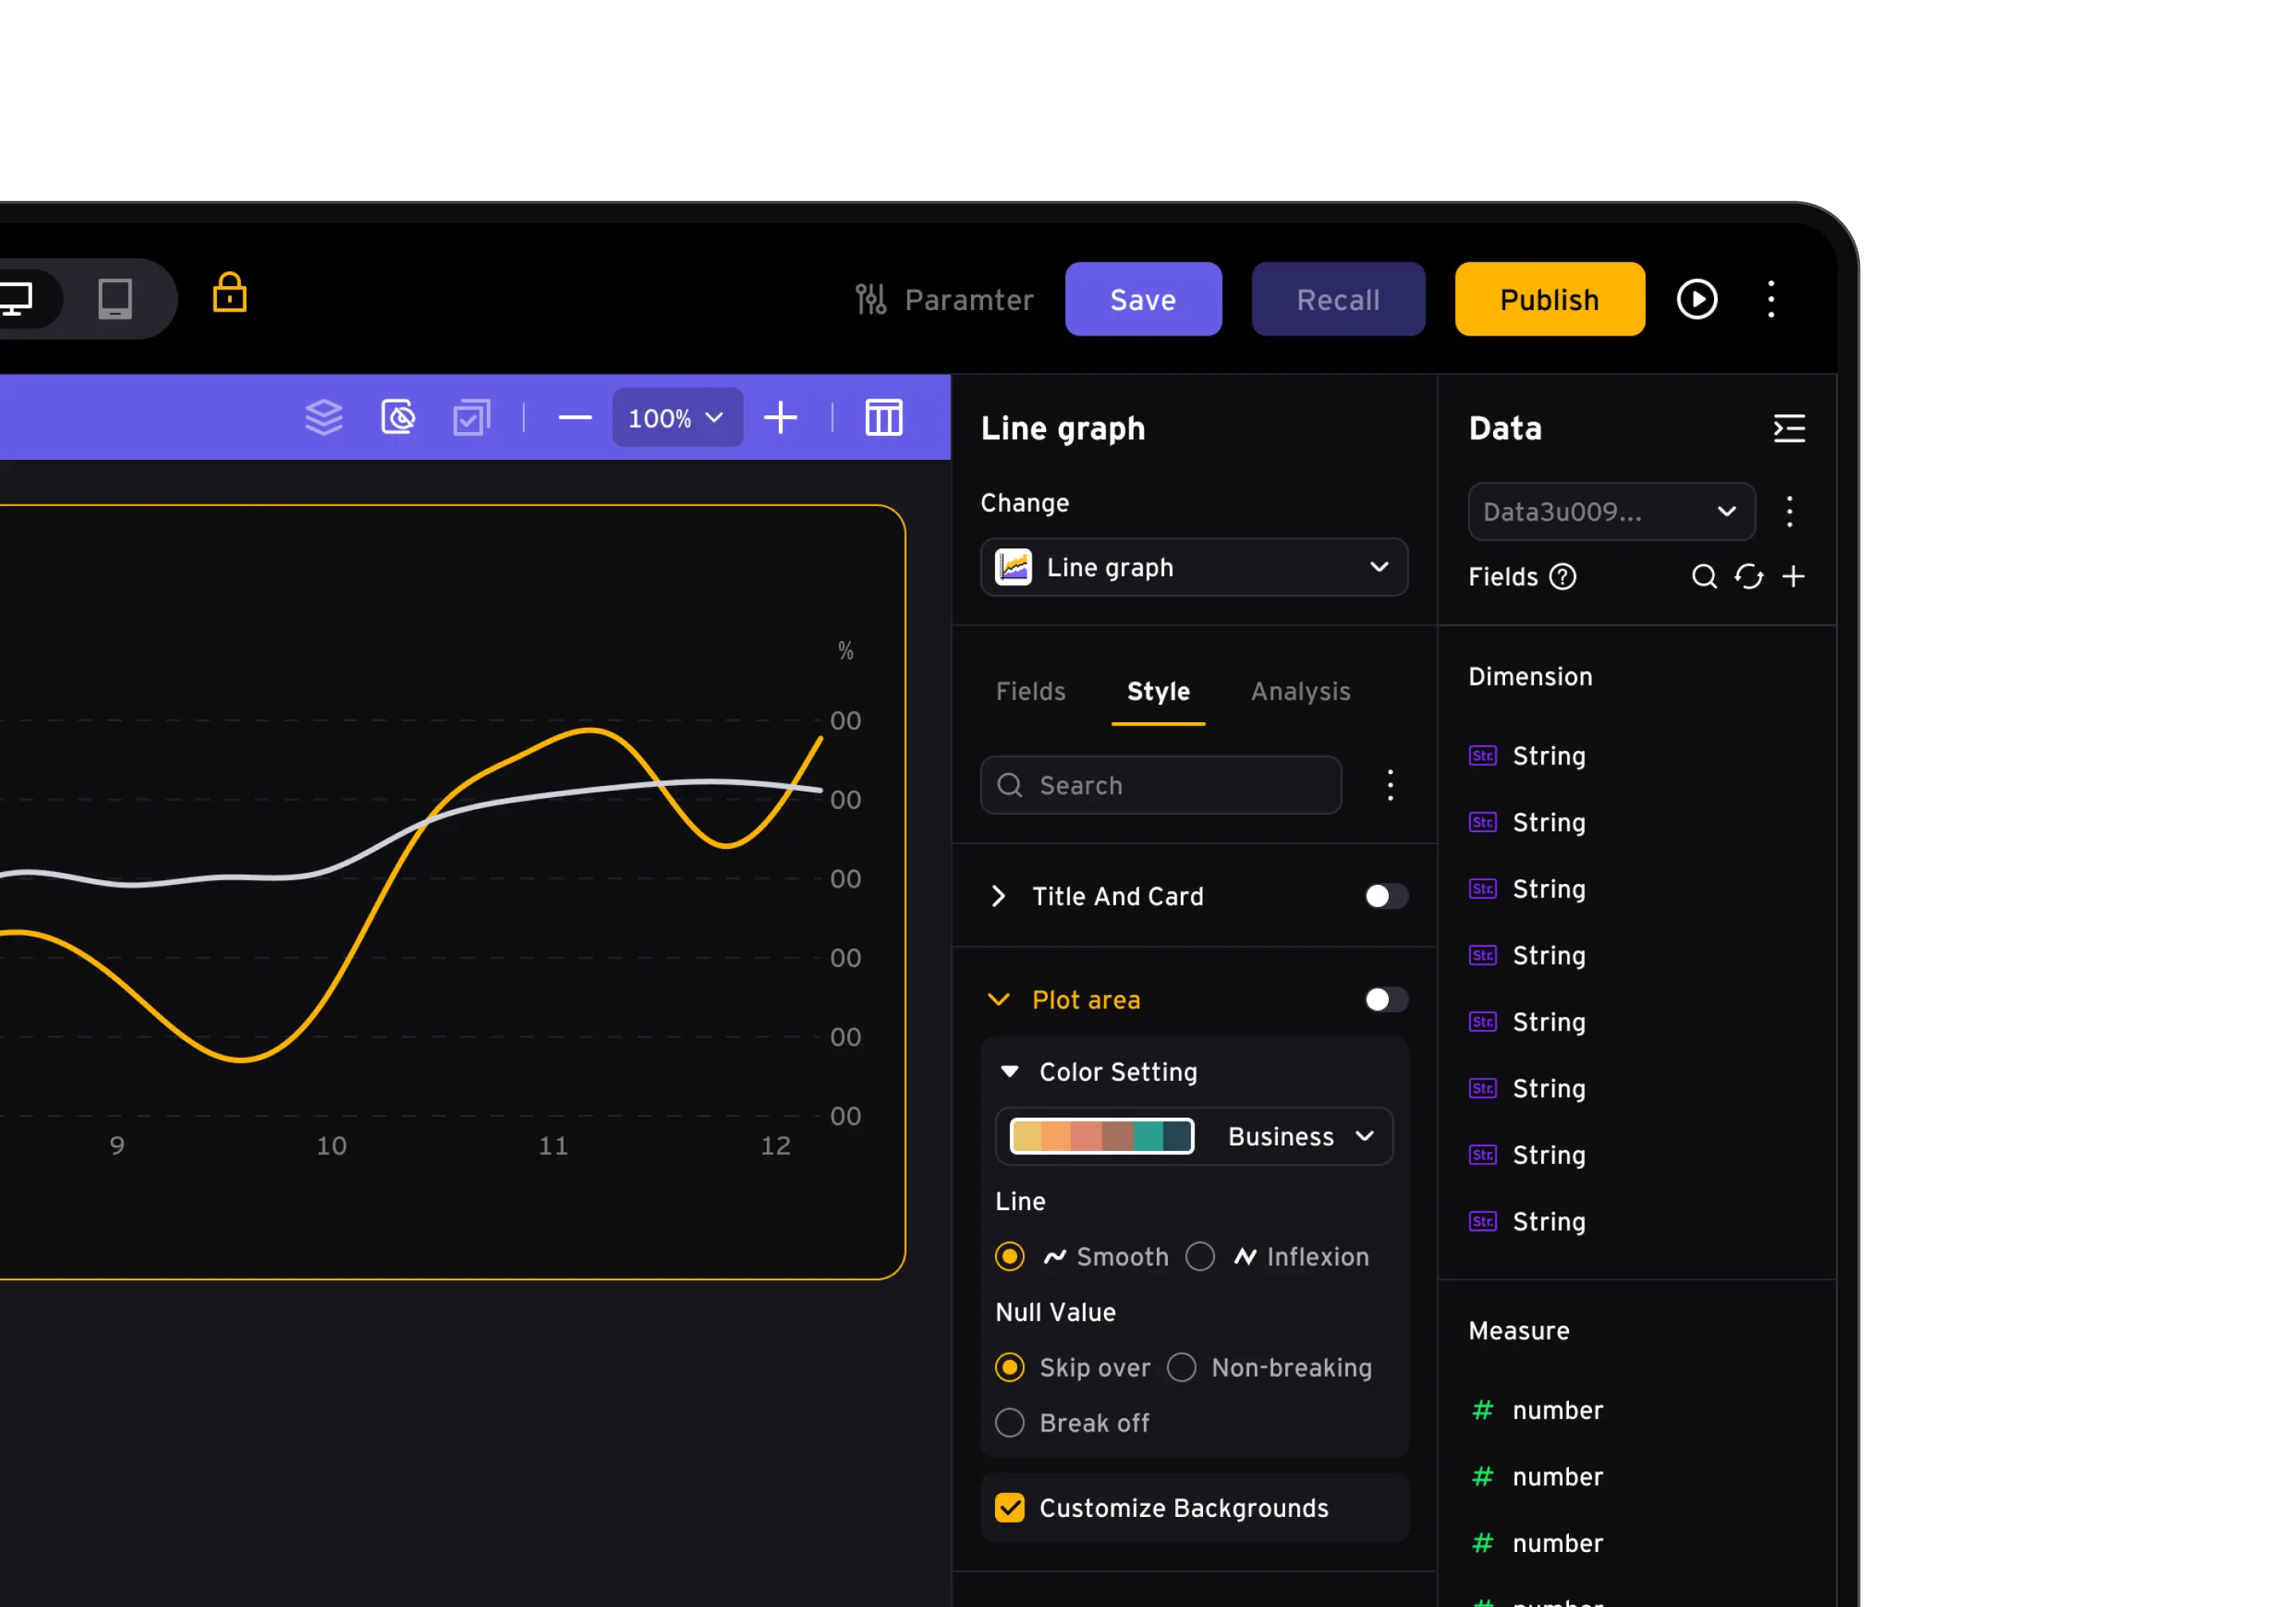
Map dimensions and measures into chart-specific slots.
04
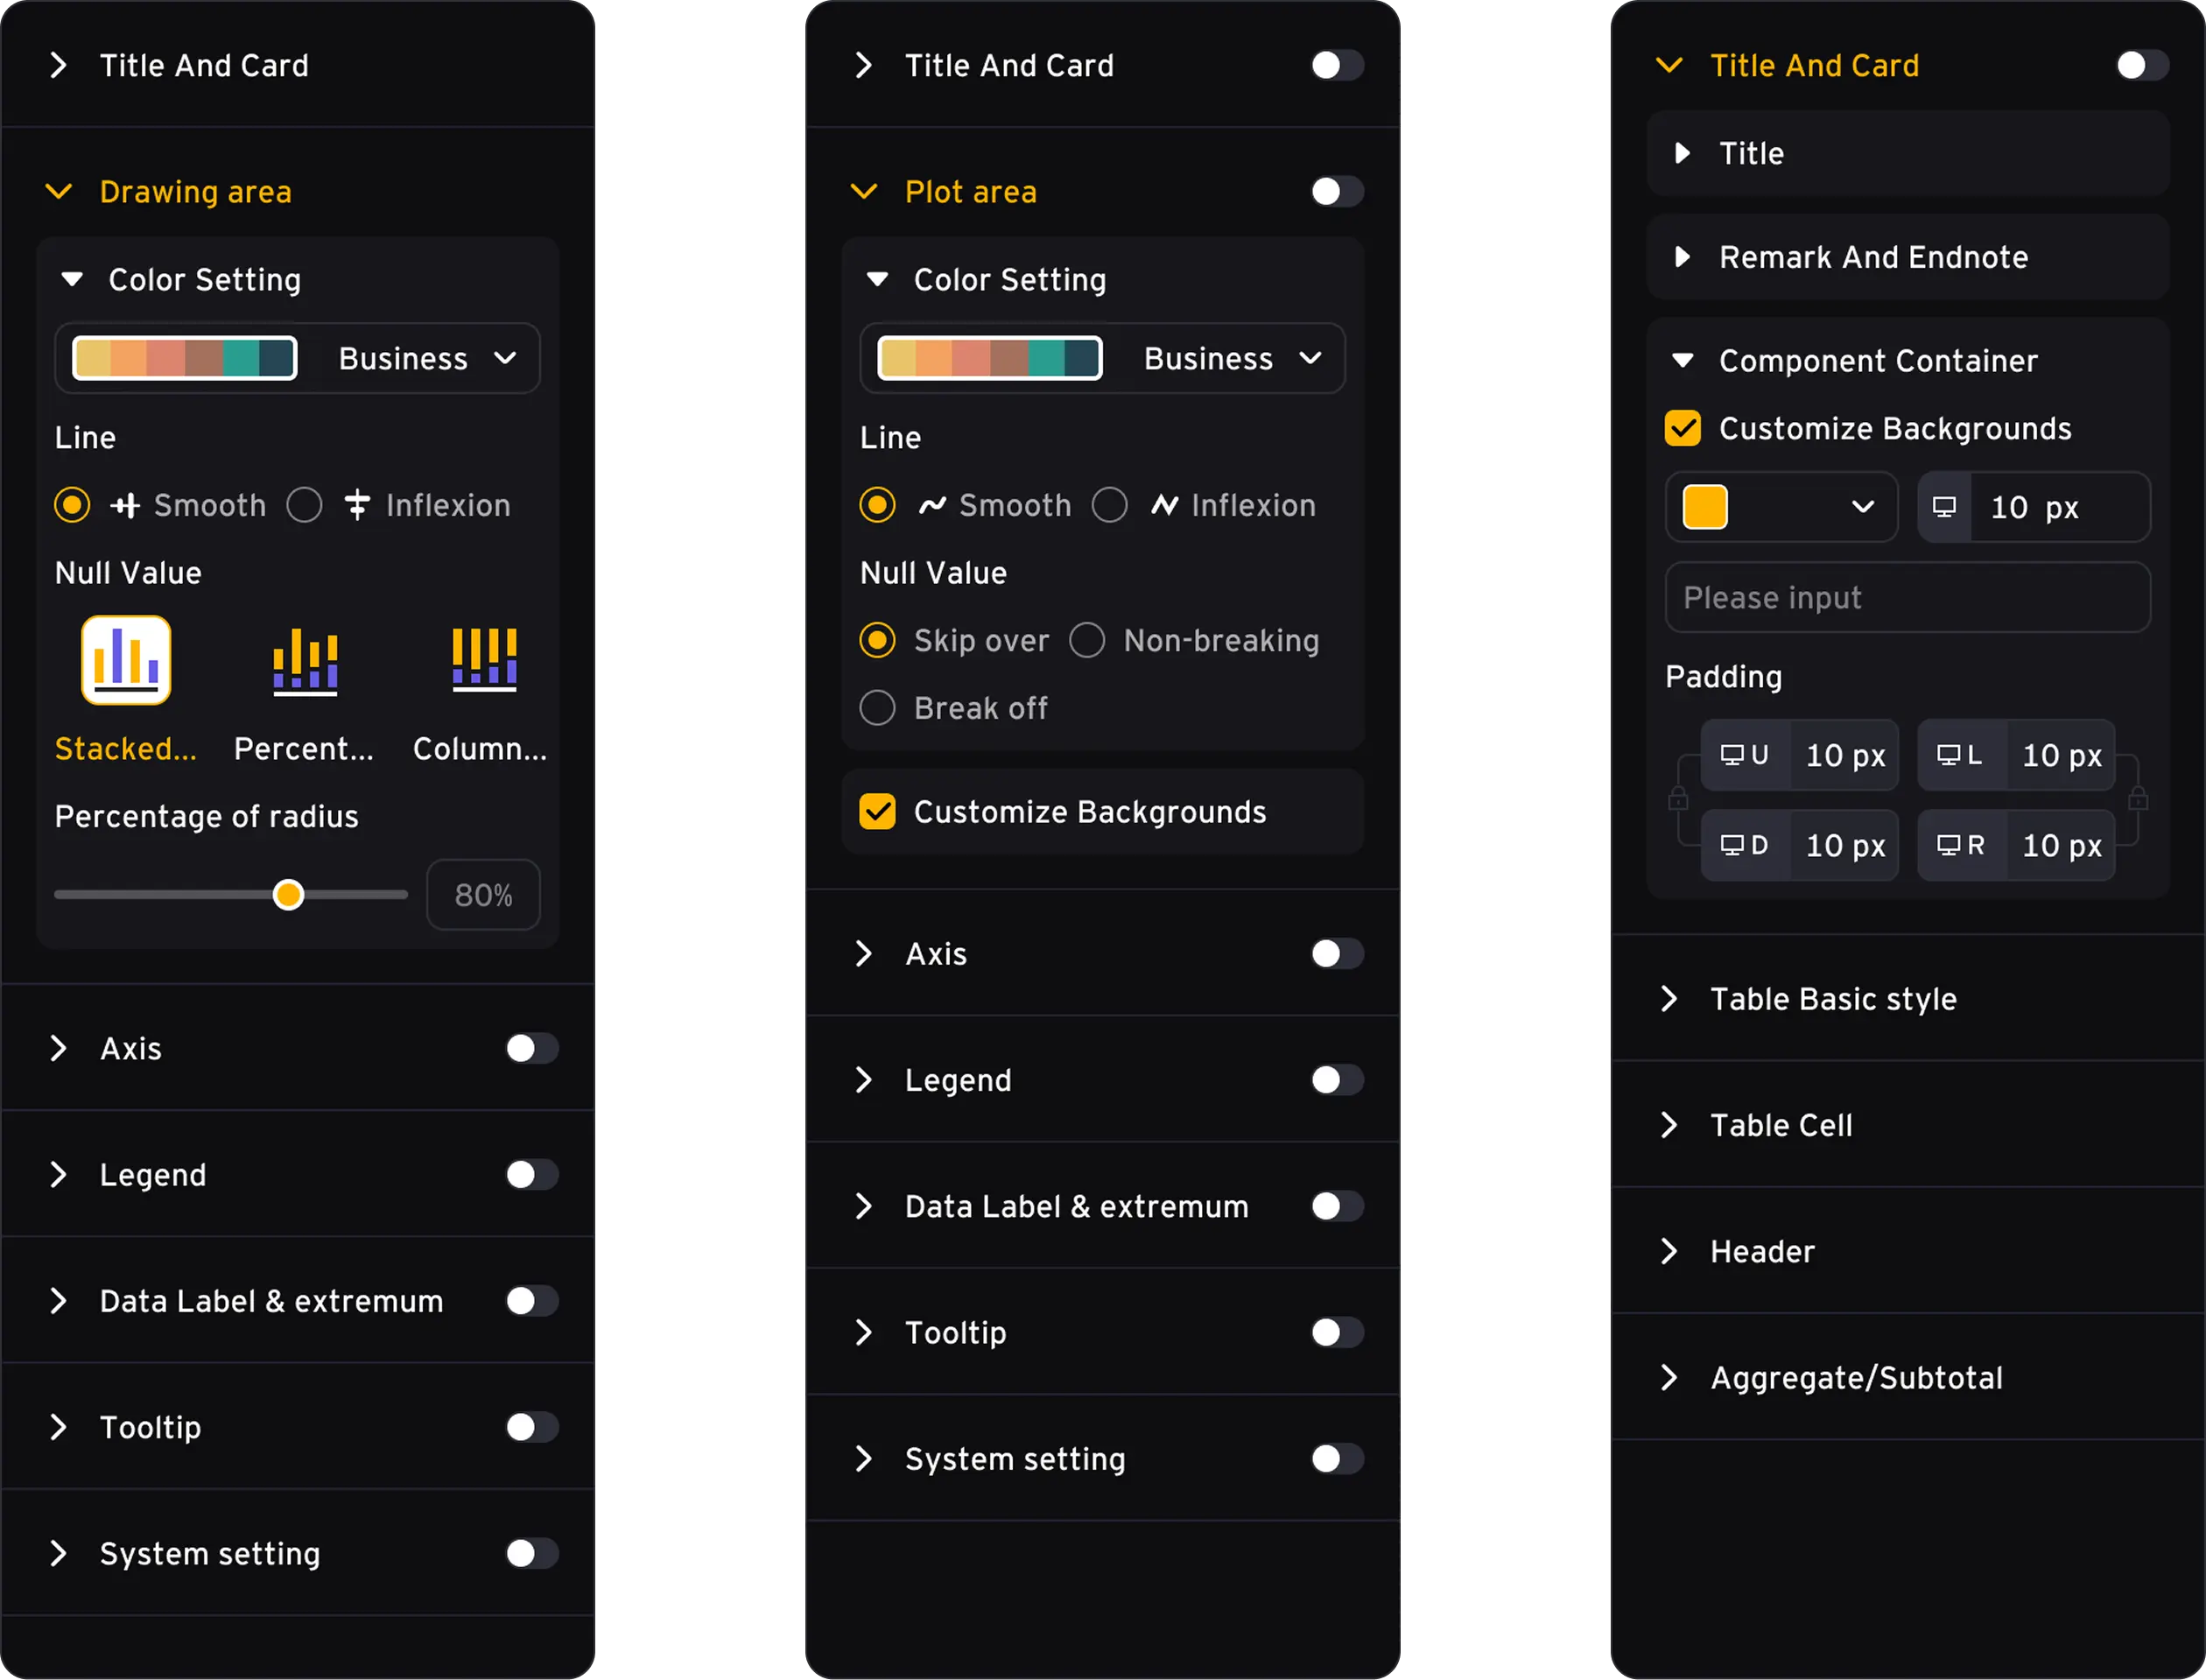
Control theme, spacing, tables, and component presentation.
A simple structure for a complex
The design separates dashboard governance from dashboard creation, then uses a familiar three-panel editor to reduce the learning curve for non-technical users.
Enterprise reporting often depends on manual Excel or slide workflows. Dashboards are hard to reuse, data ownership is unclear, and non-technical users need a simpler way to build visual reports.
Design a governed BI builder with dashboard management, drag-and-drop components, field binding, theme configuration, and publish controls in one coherent workflow.
Key interfaces designed around dashboard creation and

A centralized list for searching, editing, checking, downloading, and tracking published dashboards across the organization.
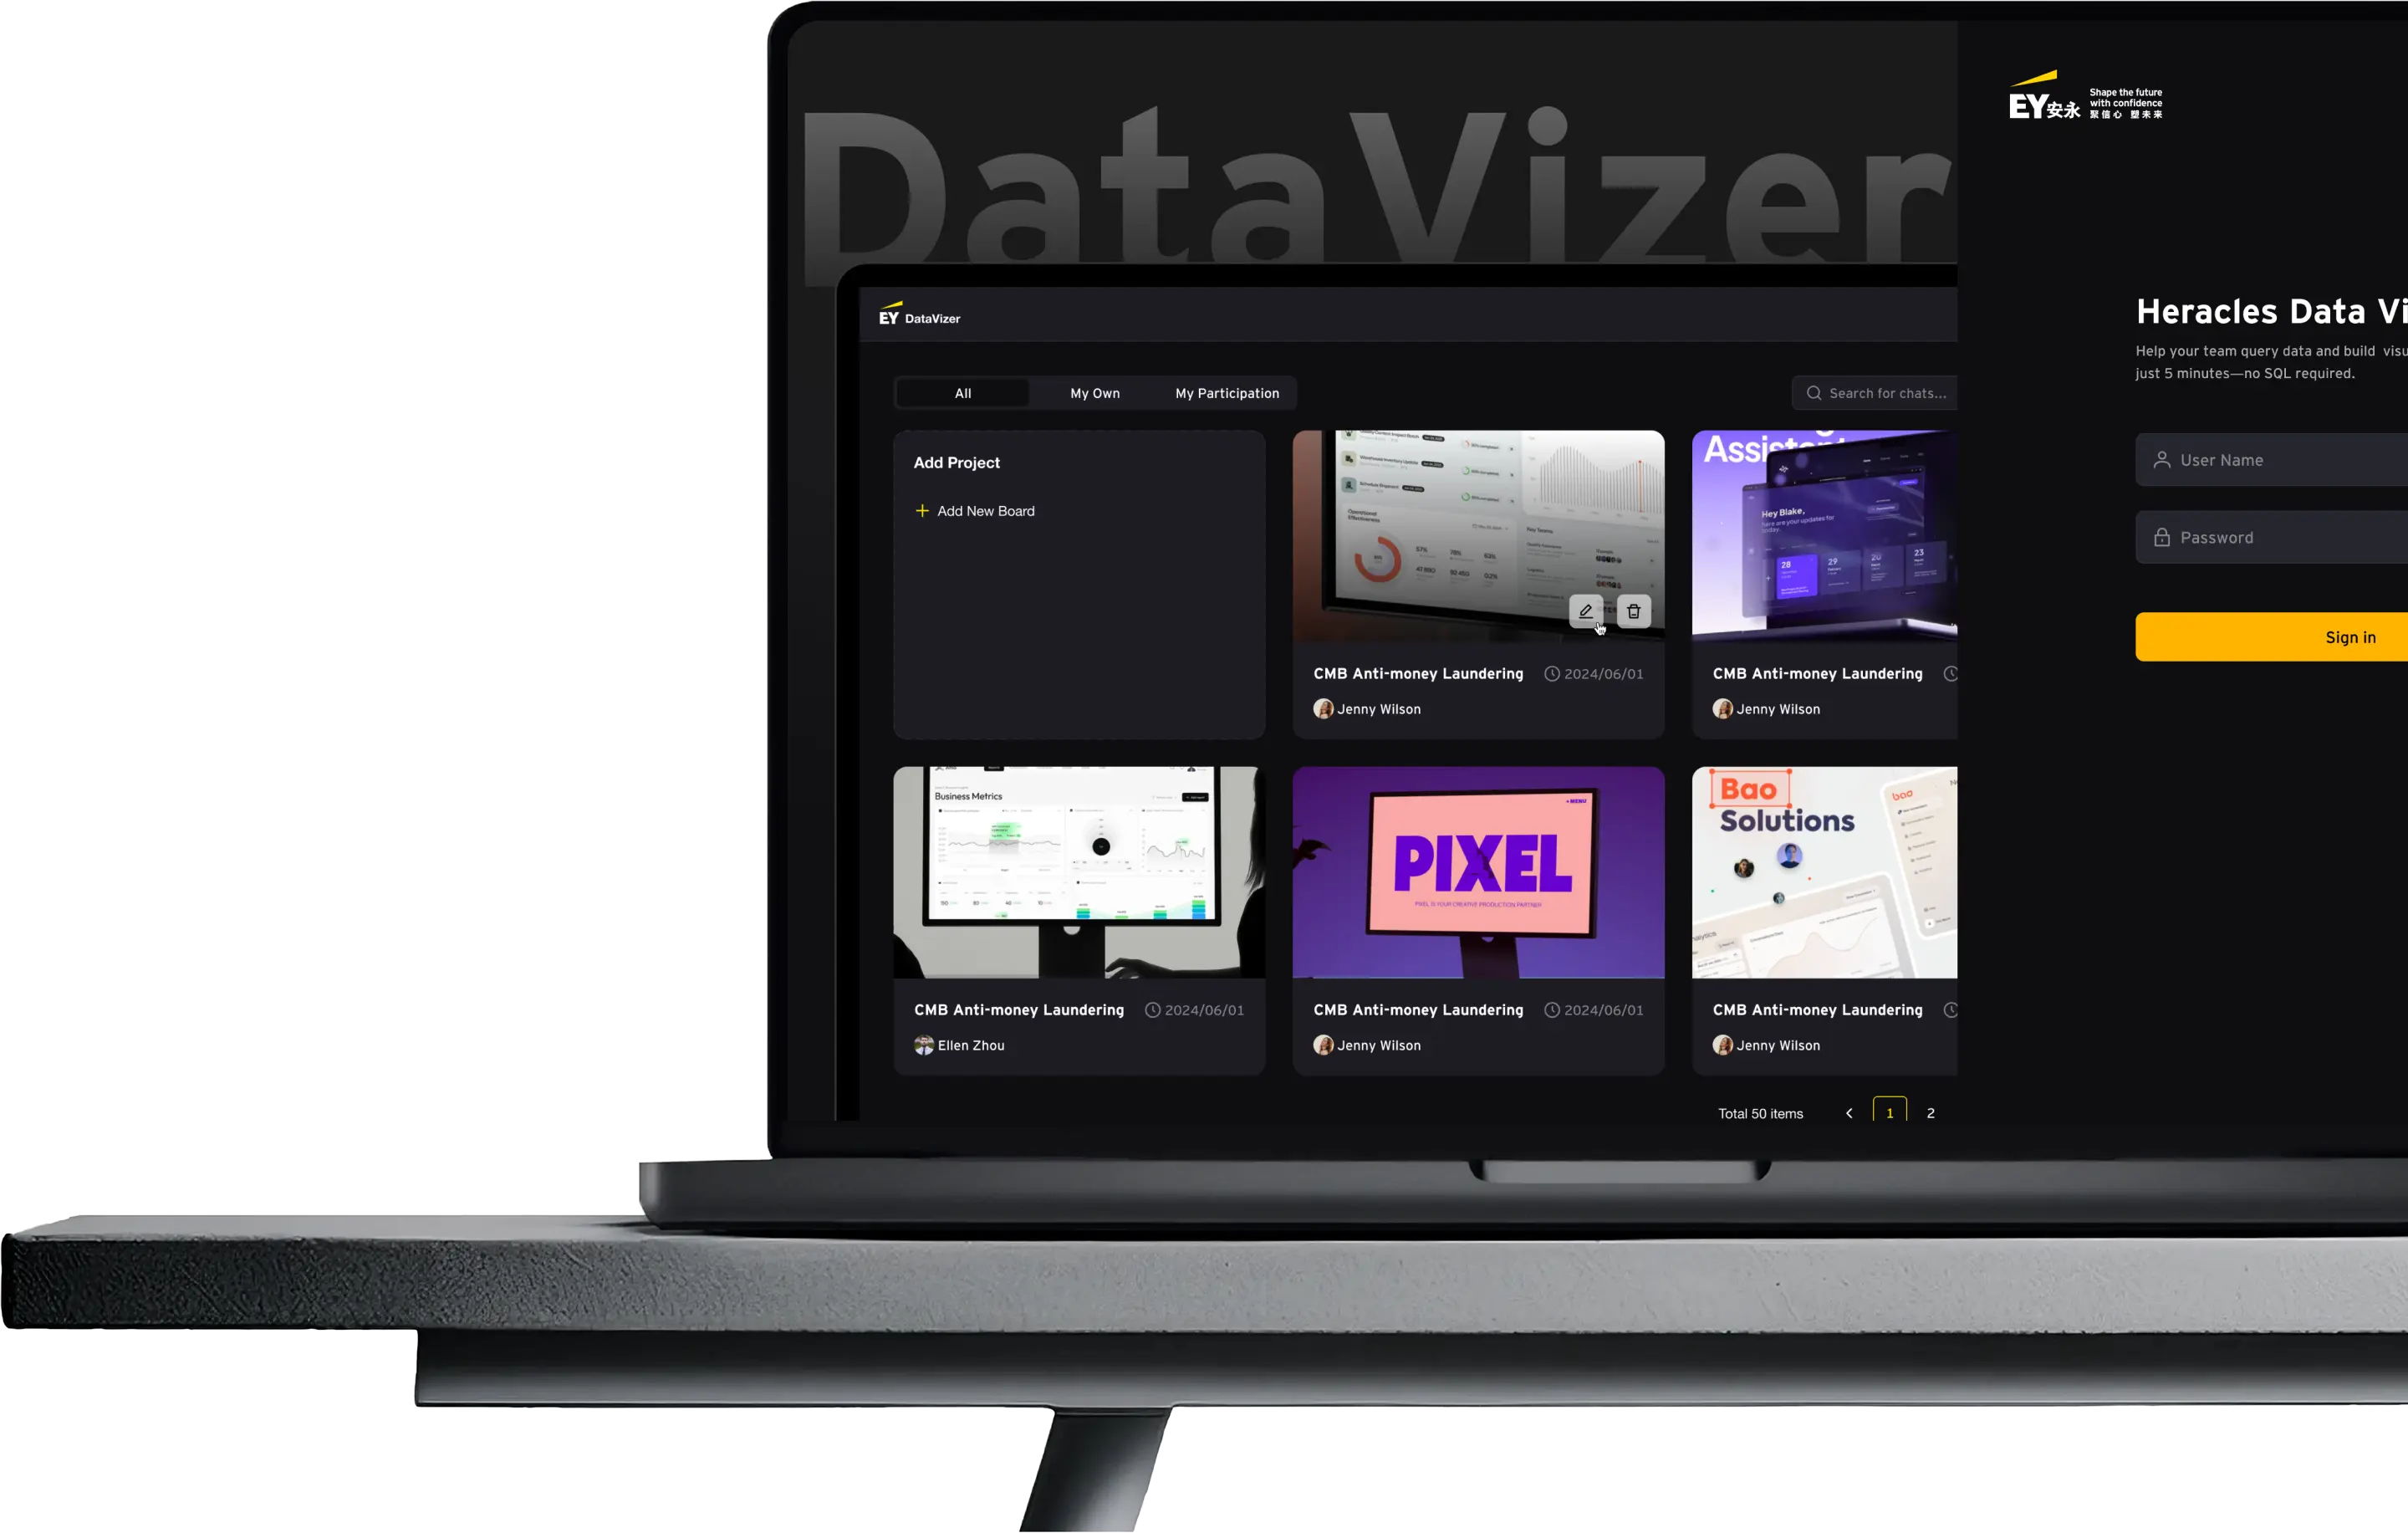
The login view introduces the product promise while showing the project workspace behind it, setting expectations for a managed data-product environment.
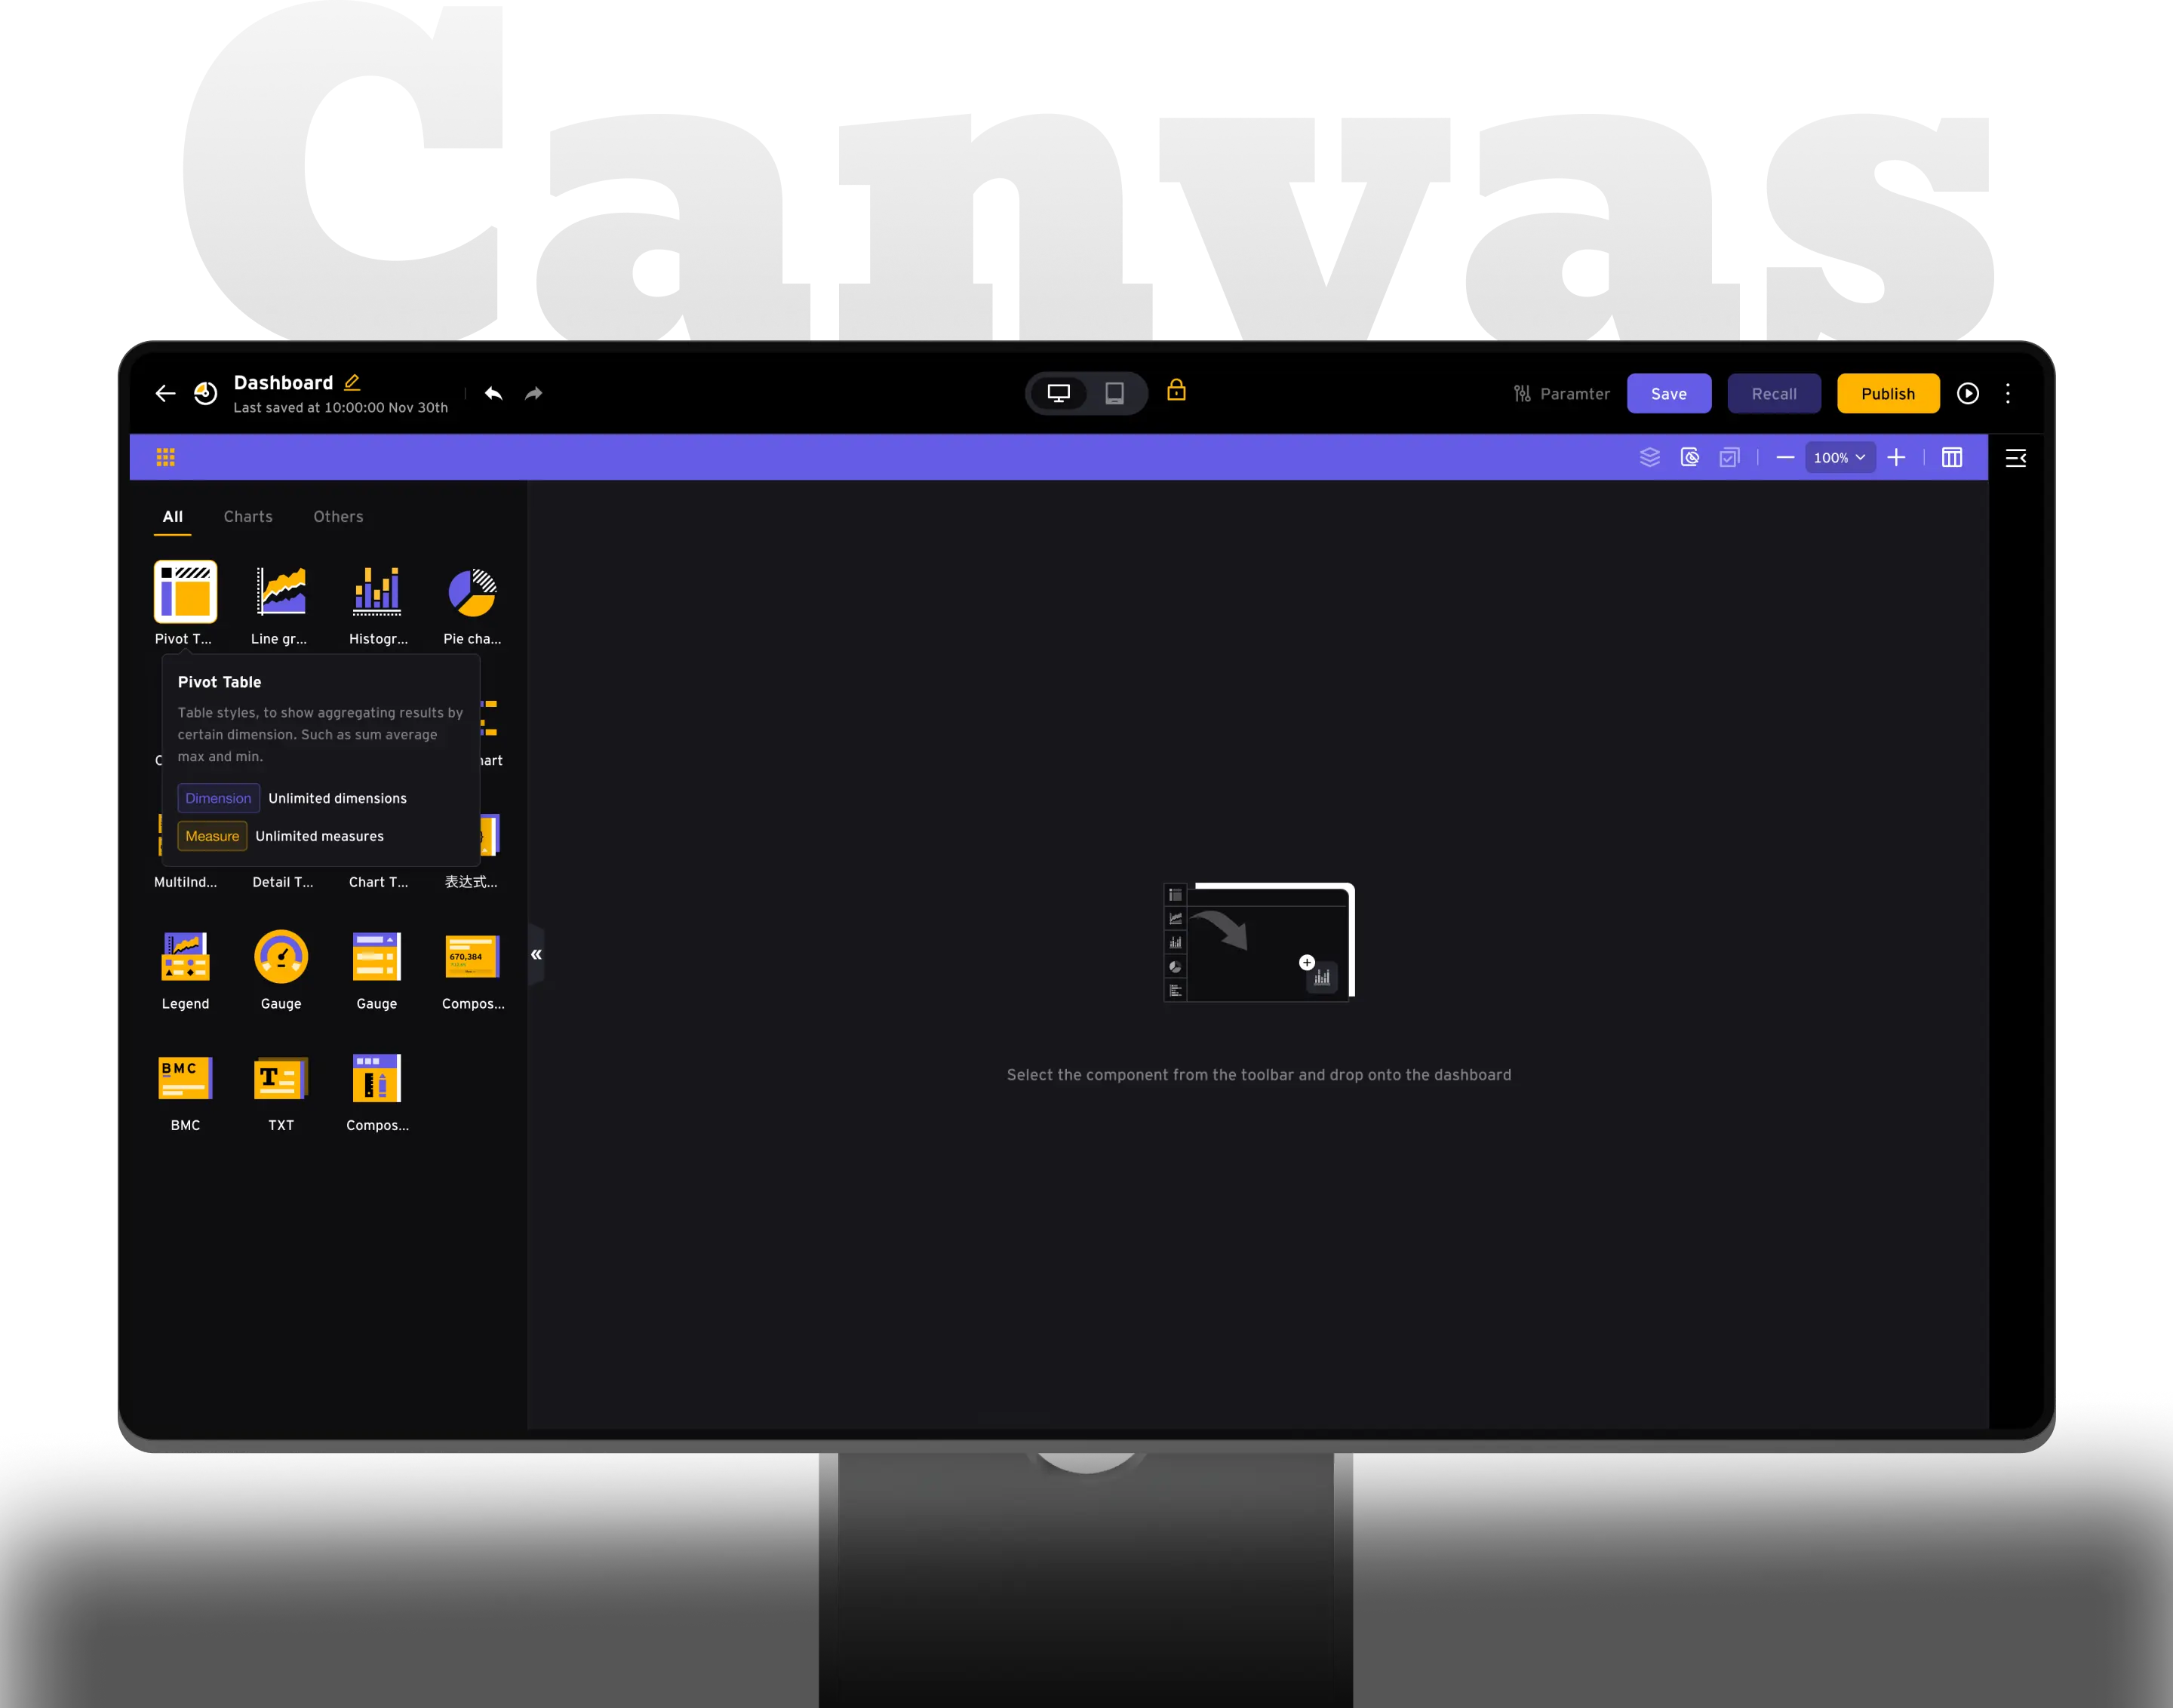
The left panel makes chart types discoverable through visual components, tooltips, and category tabs before users place anything on the canvas.
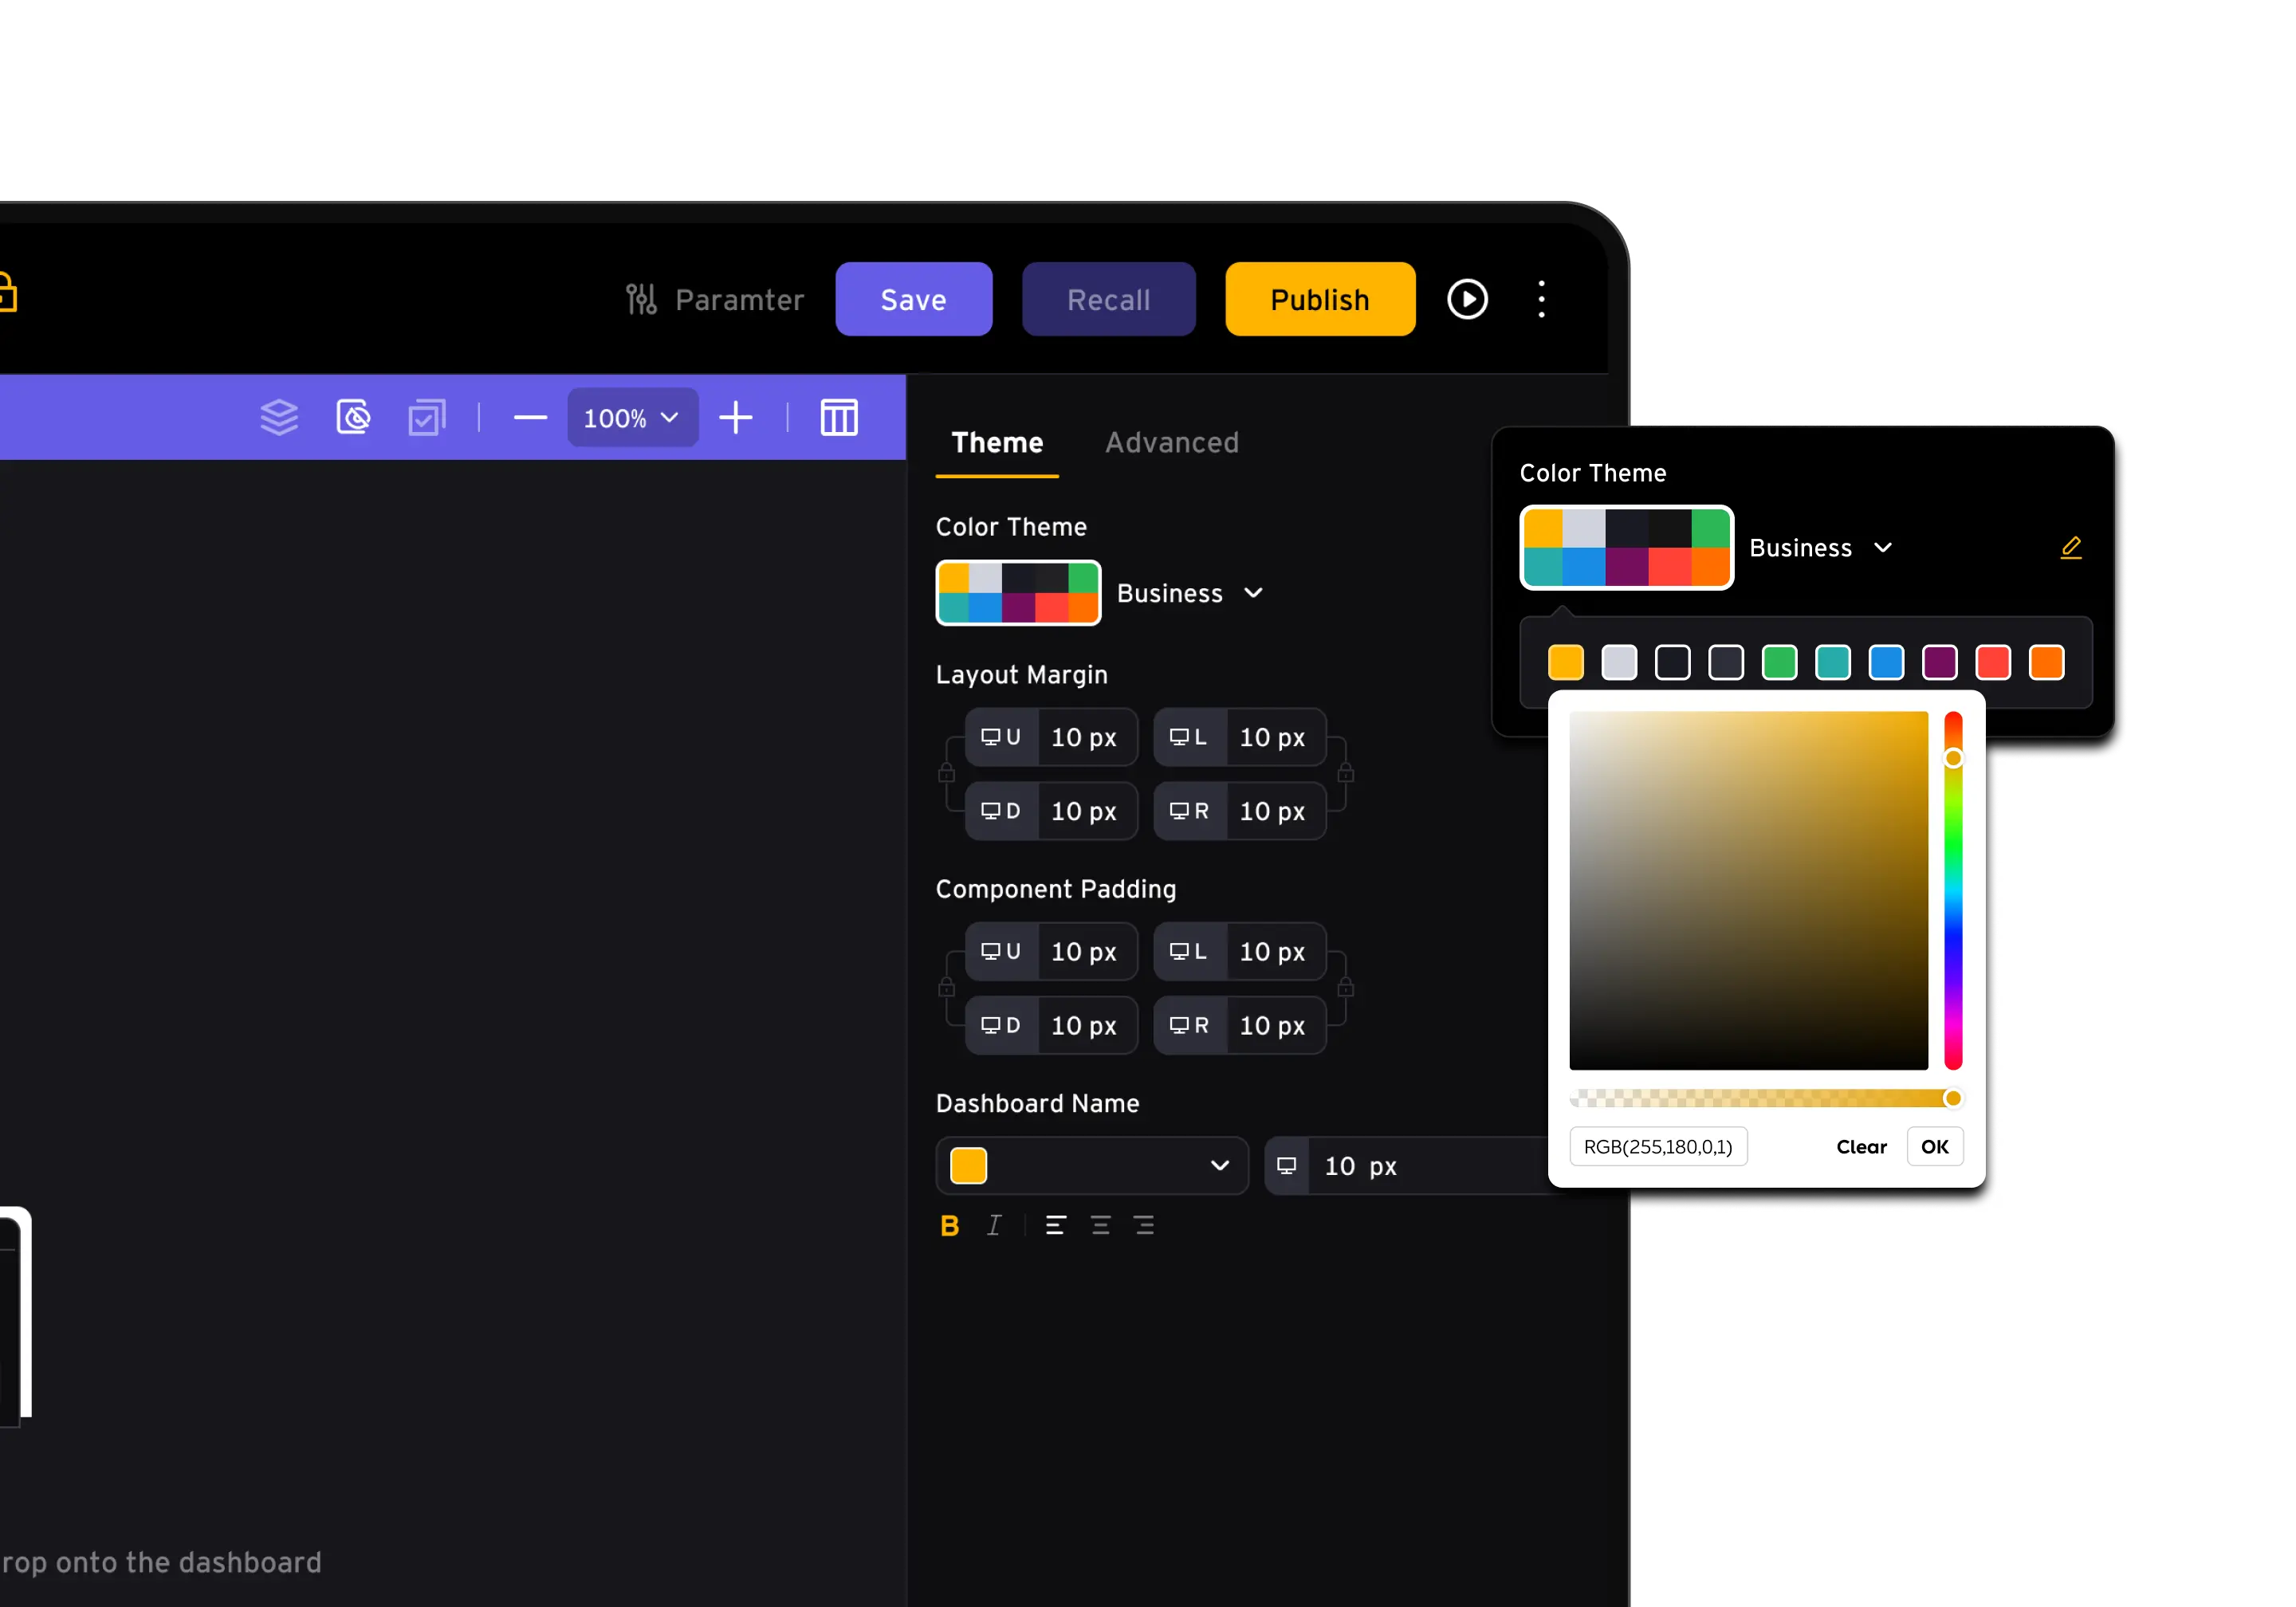
The theme panel centralizes color theme, layout margin, component padding, and dashboard title settings for consistent dashboard setup.
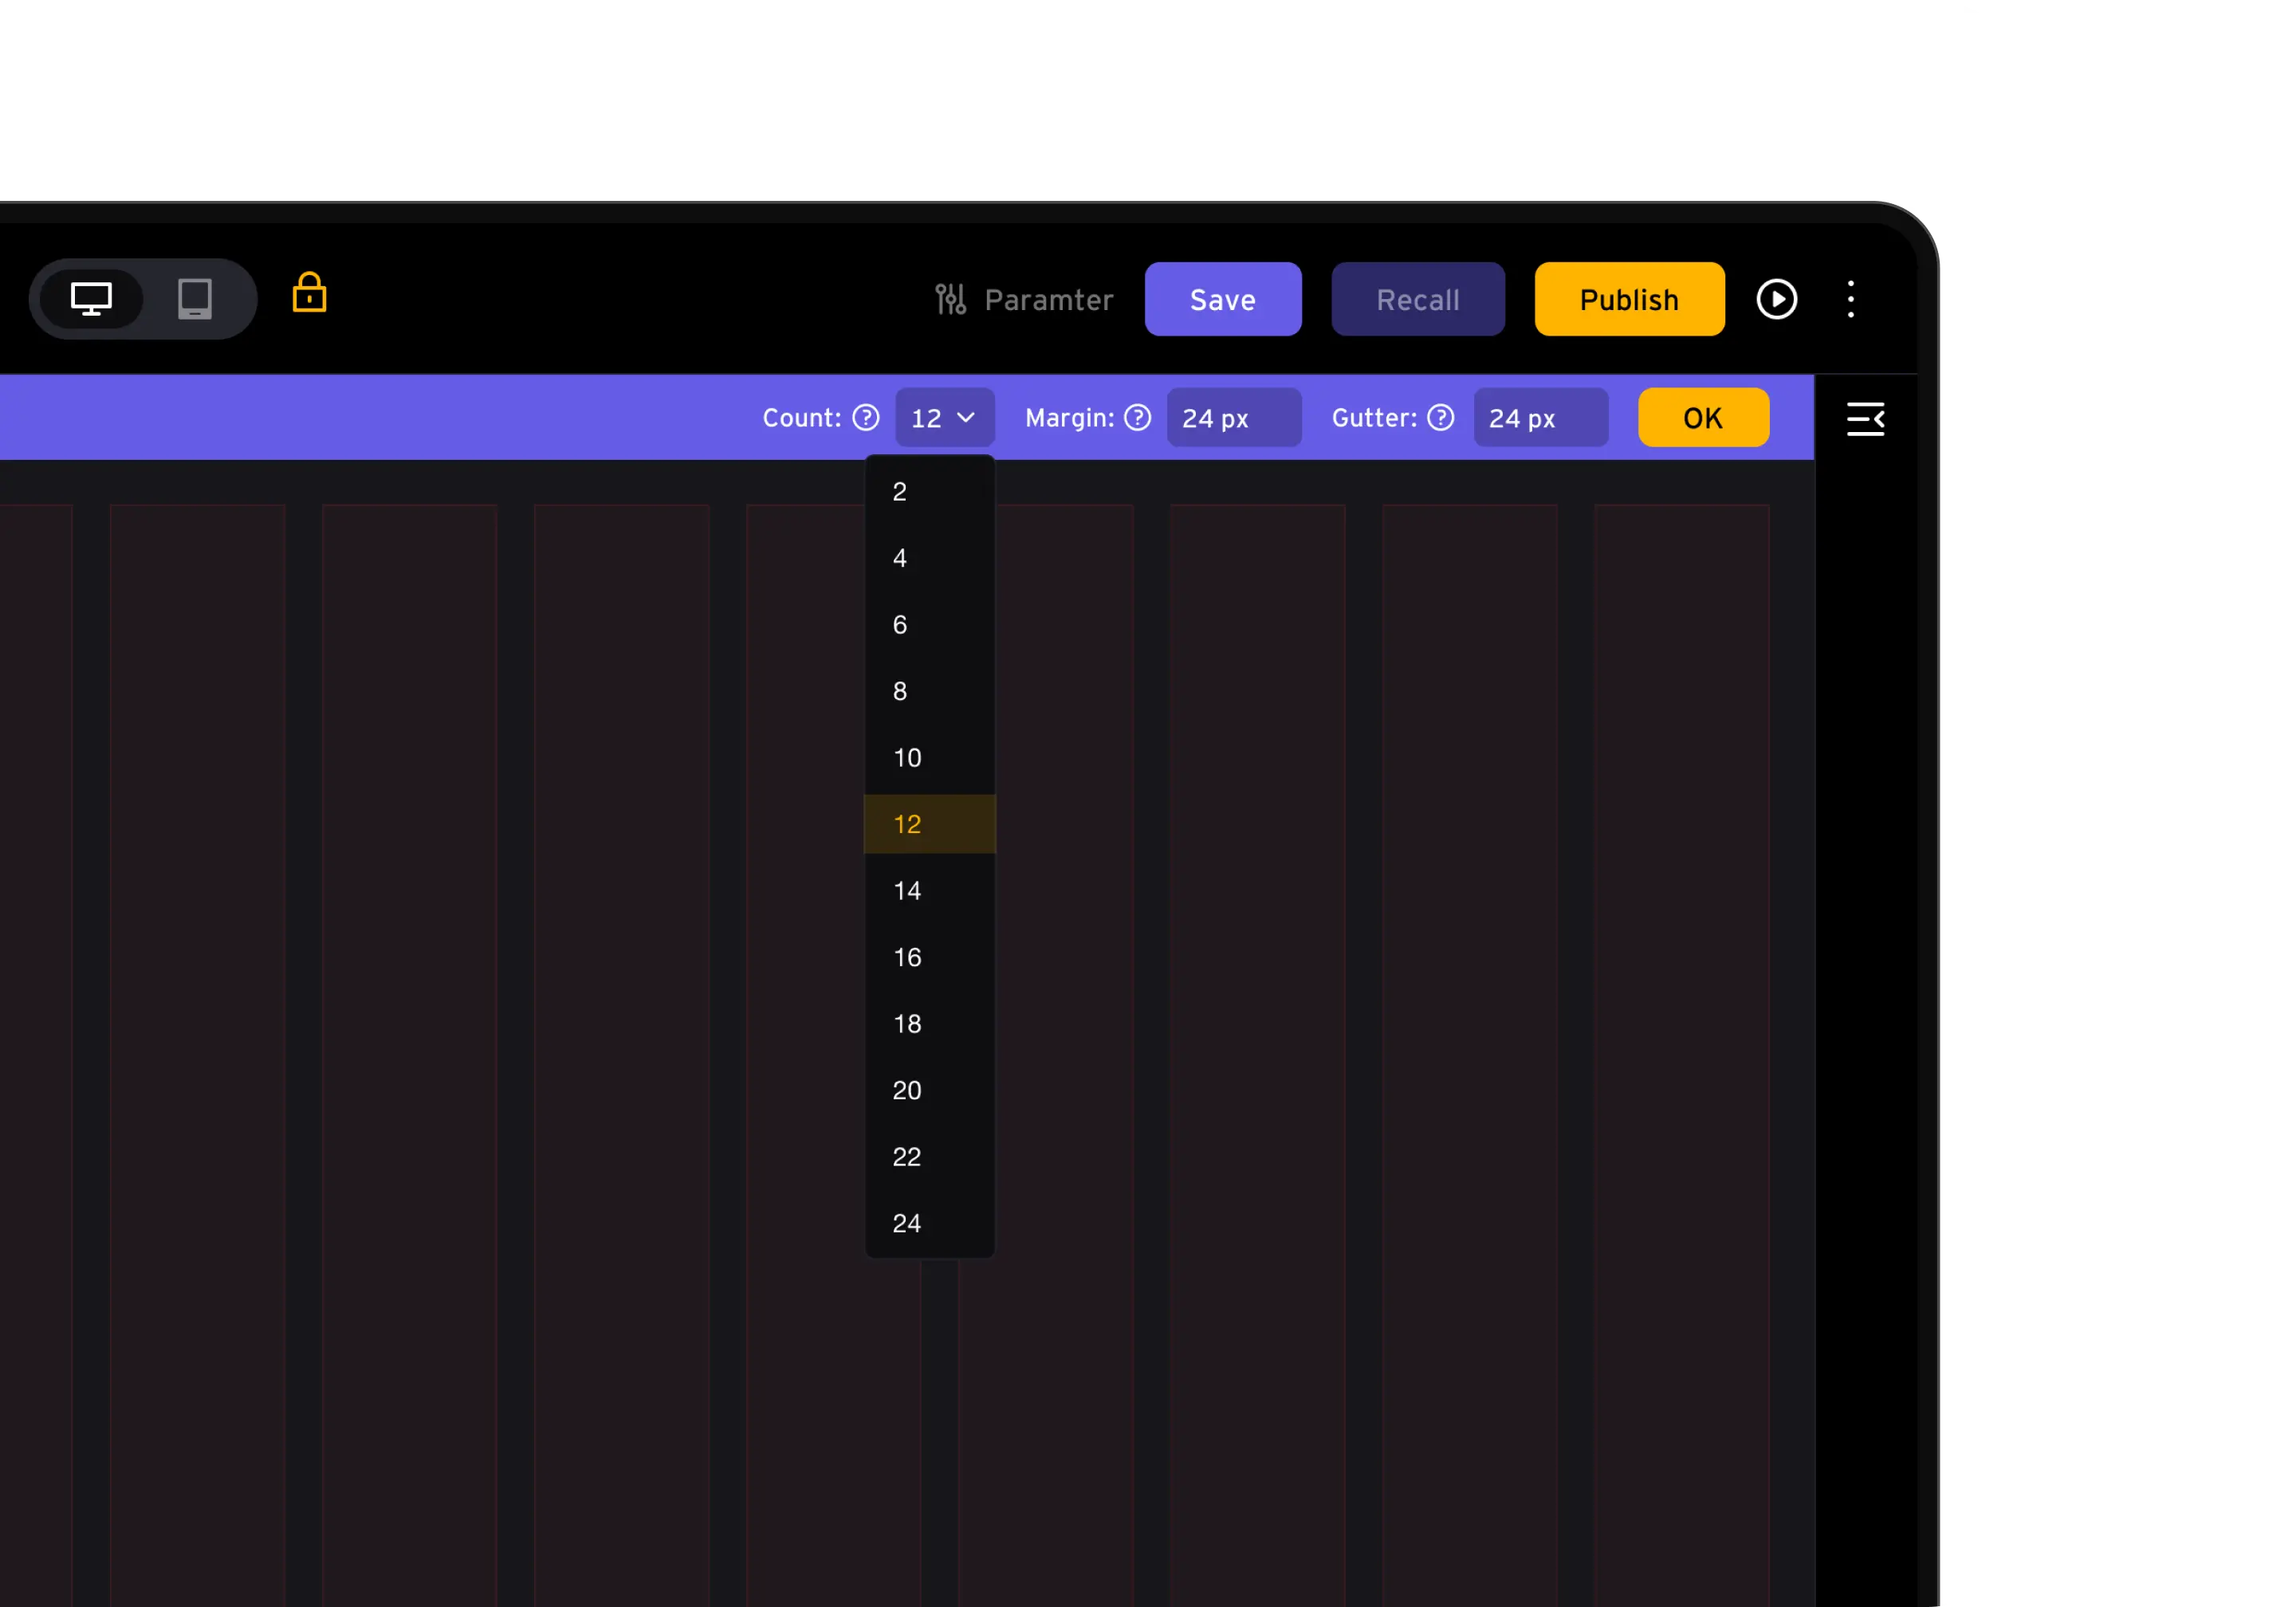
The grid setting mode gives users control over grid count, spacing, card units, and line spacing, improving alignment across dashboards.
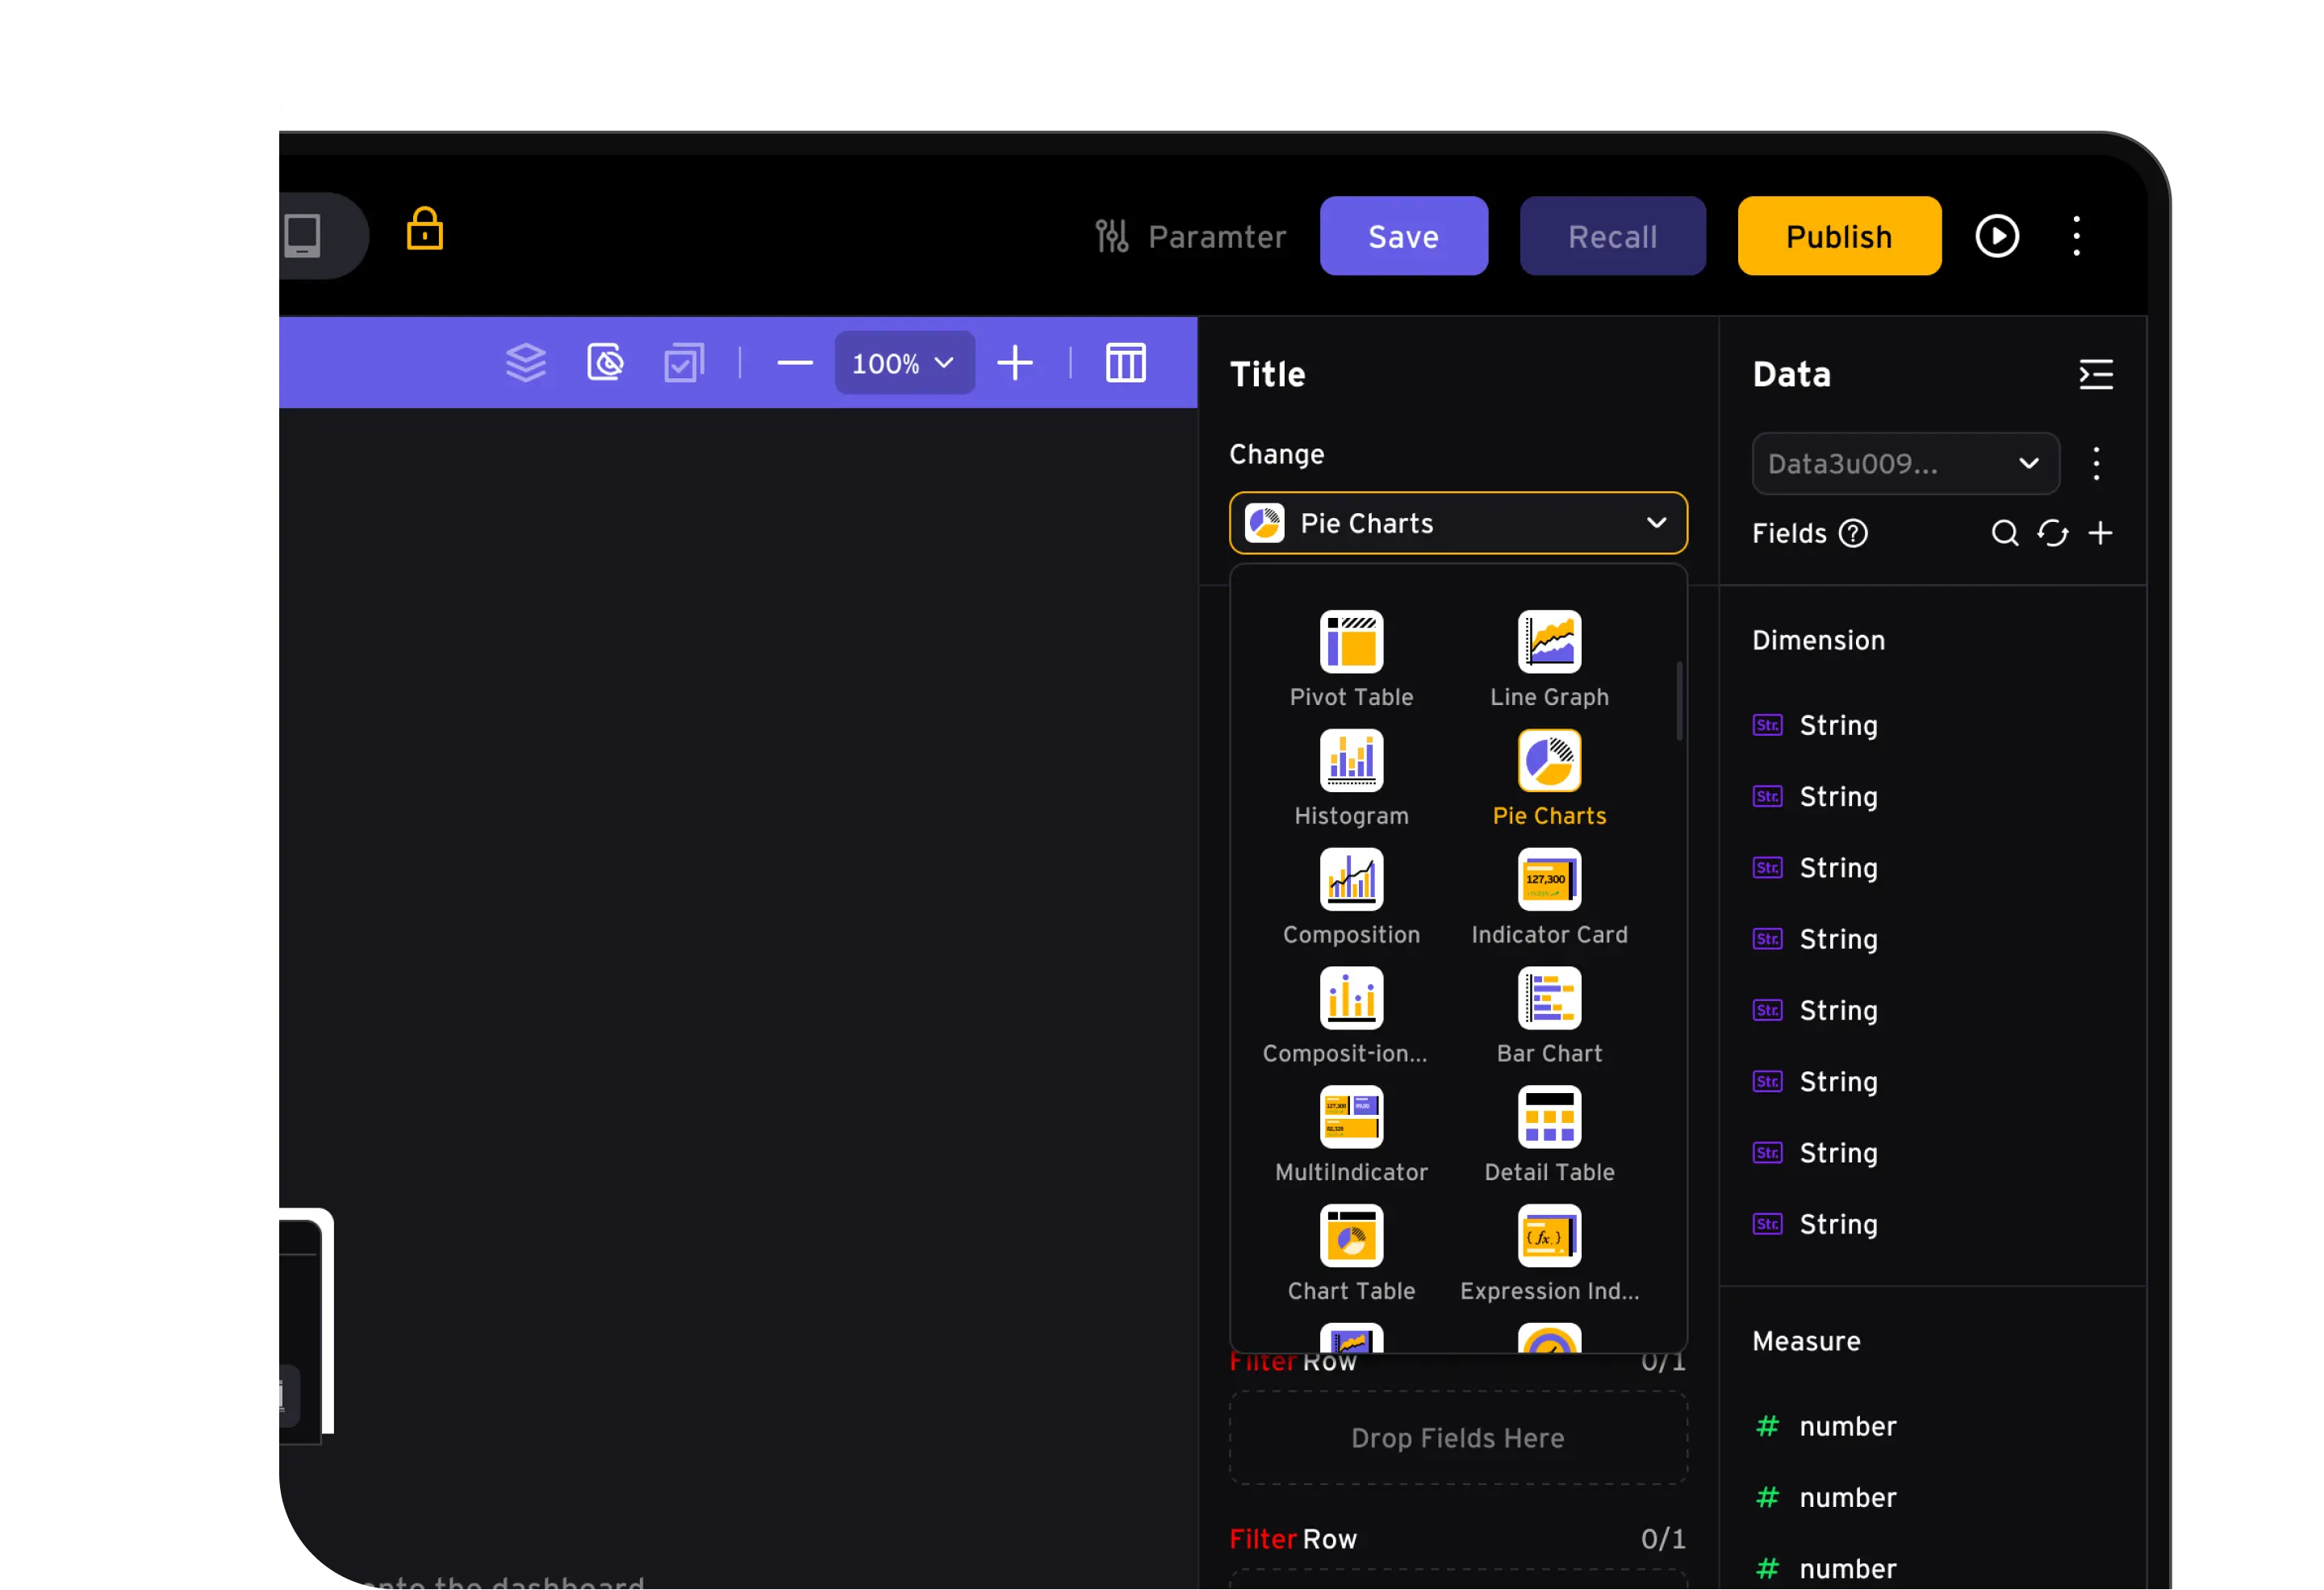
Right-side panels keep chart switching, dimensions, measures, filters, sort, and refresh controls close to the selected component.
One configuration framework supports analytical charts and delivery-ready tables: users can tune visual expression for trends and comparisons, then format structured report output.